
Documentation
What each view shows, how to read it, and what the numbers mean.
Getting started
- Create an account with Google or an email and password, and verify your email.
- Pick a plan. If it is not for you, ask for a refund within 7 days: on the gammawalls discord or at support@gammawalls.io. Your key is emailed to you and shown, censored, in the top bar.
- Open the Windows app and paste the key into the Key field. The key is your password; there is no username.
The app covers QQQ and SPY, refreshed every minute. The tabs along the bottom switch between views, and the ticker selector at the bottom right switches the underlying for every tab.
Controls that work everywhere
- Date arrows step through earlier sessions. The app follows the newest session and rolls to the next one when it starts.
- Session slider (under most views) sets the window you are looking at, from the overnight session to the 16:00 close. The right handle is also the "as of" time in PIN LAB.
- Mouse: the wheel zooms, dragging pans, a double click resets. Details are listed under each view.
- Colours: purple is positive, pink is negative, white is price. Charm uses orange for positive and blue for negative, labelled on the colour bar.
TRACE
A heatmap of options exposure by strike (vertical) and time (horizontal), with the price line on top. It shows where the exposure sits and how it built up through the session.
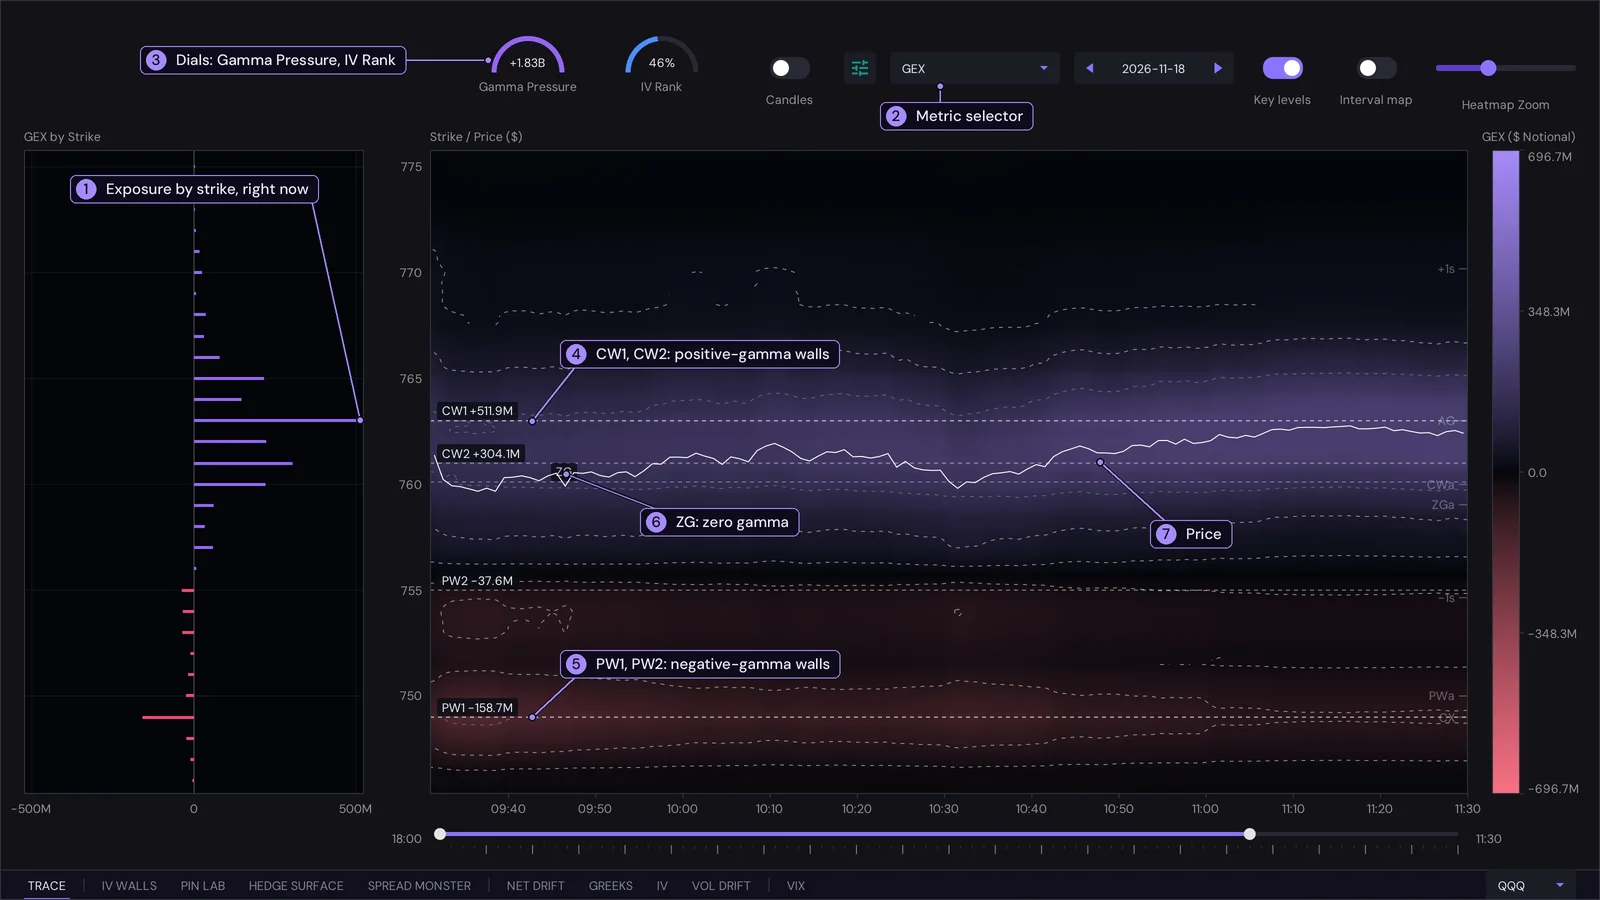
- Exposure by strike. The bars on the left are the exposure of each strike right now: purple to the right is positive, pink to the left is negative. It is the latest column of the heatmap, turned on its side.
- Metric selector. Switches the heatmap between GEX, DEX and Charm (see Definitions).
- Dials. Gamma Pressure is the net GEX of the five strikes just above and the five just below price, against their gross total: a full arc means the nearby strikes all lean one way, and the colour says which way. IV Rank is where today's 30-day implied vol sits in its range over the lookback, from 0% to 100%.
- CW1, CW2. The two strongest positive-gamma strikes, with their size.
- PW1, PW2. The two strongest negative-gamma strikes.
- ZG, zero gamma. The price where cumulative net exposure, summed from the lowest strike up, changes sign.
- Price. The white line is the underlying, minute by minute.
Interpreting it
- Brightness is size, colour is sign. A bright purple band is a zone where dealers hold a lot of positive gamma: they sell rallies and buy dips there, so price tends to be held in and slowed. Pink is the opposite: they trade with the move, so price tends to travel faster through it.
- Price against ZG. Above zero gamma the book as a whole leans stabilising, below it amplifying. The same market feels calm above ZG and jumpy below it, so a break through ZG is worth noticing.
- Walls as soft limits. A strong CW above price is a strike where dealer hedging tends to slow a rally; a strong PW below price does the same for a drop, and can also be where moves accelerate once it breaks. They are zones that matter, not guarantees.
- Persistence. A band that stays bright all session is established positioning. One that fades is being unwound or has lost its relevance as price moved away; one that appears suddenly is new.
- Switch metric to answer a different question. GEX says how hard dealers push back; DEX says which way they are positioned; Charm says how that positioning changes as the day runs down.
- Reading the Charm view. Orange lobes are strikes where dealer delta rises as time passes and blue lobes where it falls. The nodes at the right edge sit on the strikes with the most 0DTE open interest, and they are where dealer delta will drift hardest once time is nearly out. A broad lobe early in the day says the drift is spread over many prices; a node says it is concentrated at that strike. The part right of the dashed line is a projection that assumes price stays where it is.
Unsure? Ask ChatGPT about this
The Charm view
With Charm selected TRACE draws a charm map: how much delta the dealers' book gains or loses per day of passing time, at every price and every minute, with a projection on to the close. For each minute and each price on the map, the 0DTE options are re-priced as if the underlying were at that price with the time that is left, and added up (calls count positive and puts negative, as in GEX). Early in the day each option's charm is spread over a wide range of prices, so the lobes are broad. As the close nears it shrinks to a narrow bell round each strike, so the lobes pinch into separate nodes at the big strikes. That is why the right side of the map breaks into nodes. Orange is positive charm and blue is negative, with a dotted outline round each lobe. Options that are not 0DTE are taken as recorded, spread over a few strikes. The strip on the left shows the same thing for right now, by price. Up to the right handle of the session slider (the "as of" time, a dashed vertical line) the map is built from the recorded book. After that line the same book is carried forward to 16:00 at the last price. Slide the right handle back to see the projection from an earlier time of day.
Controls
- Candles (left of the settings button) switches the price drawn over the plots from a line to 5-minute candles. With the interval map the price is always the line and the switch is disabled.
- Heatmap Zoom narrows or widens the price range. The settings button sets opacity, minimum node (hides exposures smaller than a dollar threshold) and smoothness (how far each strike's exposure spreads to nearby prices). The Key levels switch turns the labelled lines on or off. Hover for a crosshair with the price, time and value under the pointer.
- Brighter areas are bigger exposure. Dashed contours outline the strongest zones.
Quieter levels
Extra levels sit at the right edge as a small tick and a short tag; point at one and it draws its line and names itself.
- AG: absolute gamma strike, the strike with the most gamma of either sign (where pinning is strongest).
- VX, CX: the strikes with the largest vanna and the largest charm.
- CWa, PWa, ZGa: the call wall, put wall and zero gamma across all expiries (shown only when they differ from the 0DTE ones).
- +1s, -1s: the one-day expected move implied by the options, up and down from price.
Interval map
The Interval map toggle next to Key levels draws the same exposure as bubbles instead of a heatmap, one per strike per time bucket: the bubble's area is the size of the exposure at the close of the bucket, and its colour is the sign. A strike whose bubbles keep growing is building up; one whose bubbles shrink is unwinding. The bucket width follows the session slider, so a shorter window gives narrower buckets. The metric selector, the strike plot and the crosshair work the same in both; the interval map always draws the price as a line.
NET DRIFT
Where the money in 0DTE options is going, minute by minute since the open.
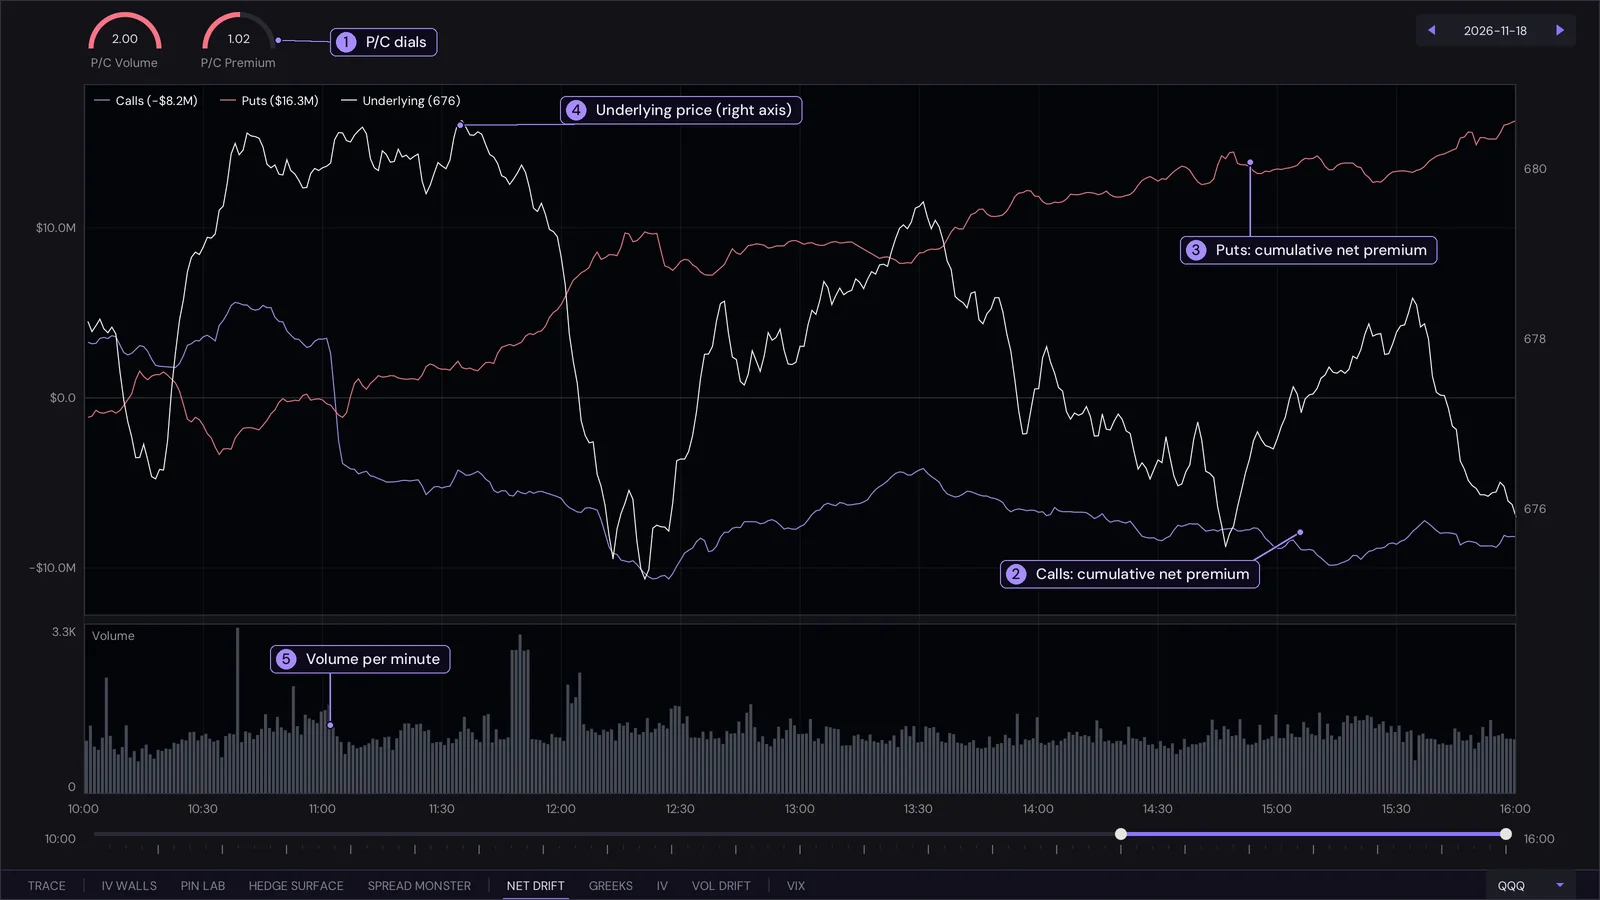
- P/C dials. P/C Volume is put contracts divided by call contracts traded since the start of the window. P/C Premium is the same ratio on gross premium (buys plus sells). Both sit at the middle for 1.0 and fill completely at 2.0 or more; they turn pink above 1.0.
- Calls. The cumulative net premium of calls: premium paid for contracts bought at the ask, minus premium for contracts sold at the bid. The figure in the legend is the latest total.
- Puts. The same for puts.
- Underlying. The white line is the price, on the right axis.
- Volume. The bars underneath are the contracts traded in each minute.
Interpreting it
- Direction of the money. A rising calls line means buyers are paying up for calls faster than sellers are hitting bids; a falling one means call selling dominates. The same goes for puts. The two lines together show whether the day is being positioned for upside, for protection, or for neither.
- Agreement or divergence with price. Calls climbing while price climbs is confirmation. Price rising while call premium falls, or puts building into a rally, means the flow is not following the move, which is the more interesting case to watch.
- P/C above 1 is more put activity than call activity. It is a statement about activity, not a forecast: heavy put buying can be protection for a long book as easily as a bearish bet. Compare the volume ratio with the premium ratio: a high volume ratio with a low premium ratio means many small, cheap puts; the reverse means fewer, bigger ones.
- Volume spikes mark the minutes when positioning changed fast. Look at what the lines did in that minute.
- Because it counts the side a trade was done on (ask or bid), it is a measure of who was aggressive, not of who ended up holding the contract.
- Hover for the values at any minute, including that minute's P/C. The session slider sets the window the dials and lines start from.
Unsure? Ask ChatGPT about this
GREEKS
The latest recorded ladder of the day as two bar charts that share one price axis. Each bar is one strike, centred on zero (positive to the right, negative to the left).
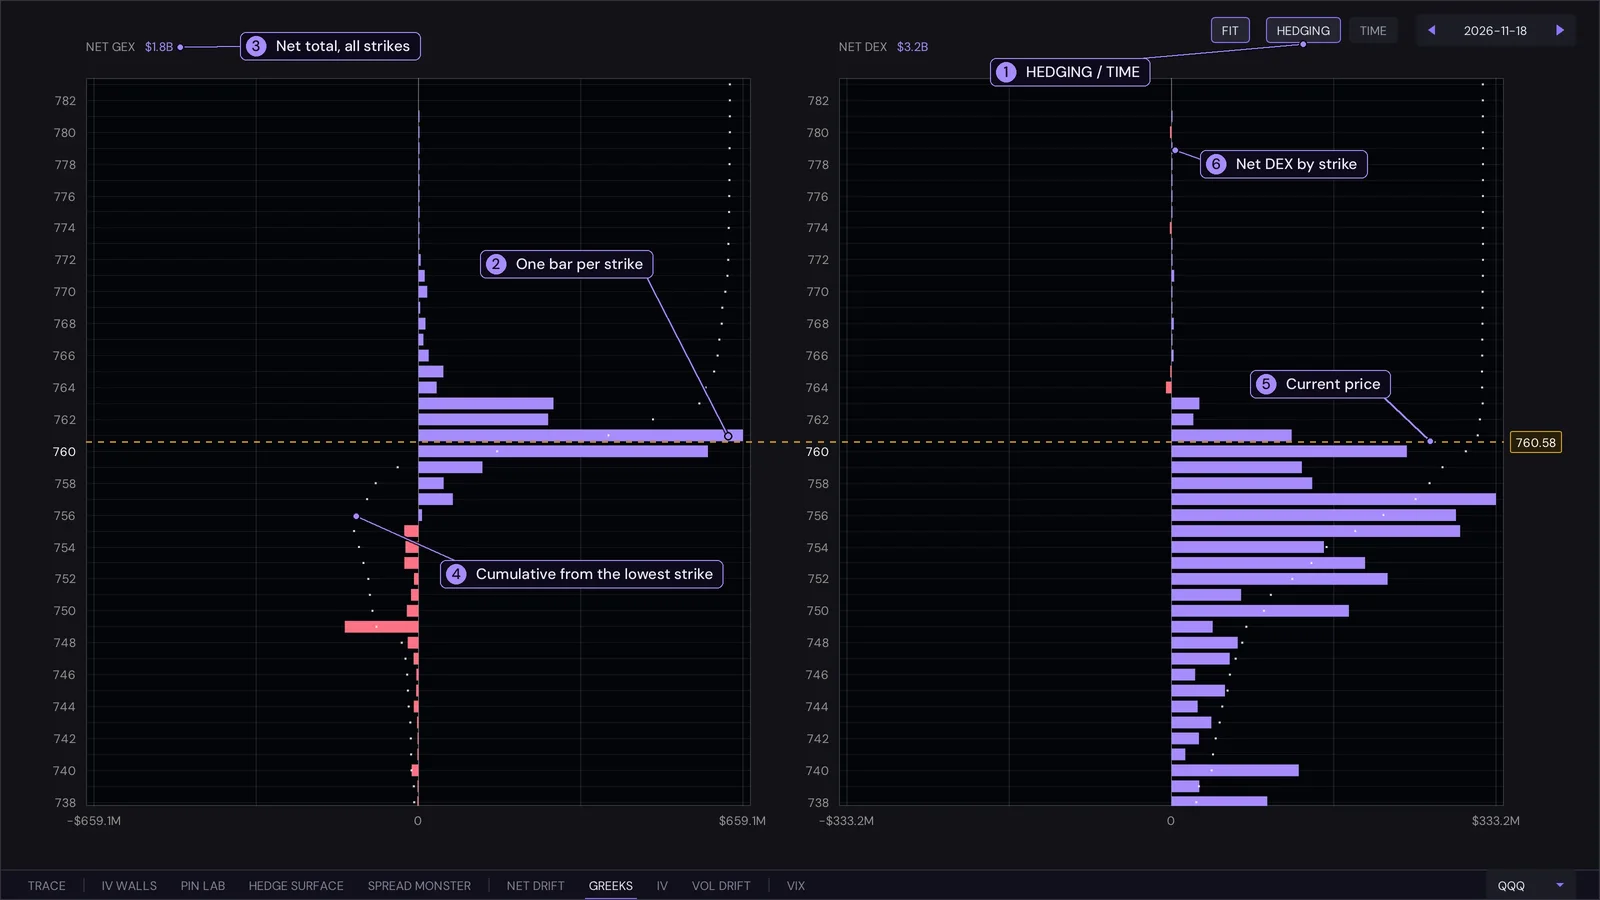
- HEDGING / TIME. HEDGING shows GEX and DEX: what dealers must trade to stay hedged as price moves. TIME shows Vanna and Charm: how their delta shifts with volatility and with the passing of time. FIT returns to the default range.
- The bars. Each bar is one strike's GEX (left chart). Purple is positive, pink is negative.
- Net total. The header of each chart shows the net total over all strikes.
- Cumulative line. The dotted line is the cumulative exposure from the lowest strike up; its sign change is the zero-gamma level.
- Current price. The dashed amber line, with the price in its tag, runs across both charts.
- DEX chart. The same strikes for delta exposure, the dealers' net directional exposure.
Interpreting it
- Tall purple bars near price are strikes where dealers hold positive gamma. They tend to cap and hold price around them, and are the likely pins into the close. Pink bars are strikes where price tends to be pushed along instead.
- Net GEX in the header is the overall lean. Strongly positive means the market is, on balance, stabilised by hedging; near zero or negative means moves are not being damped.
- Where the cumulative line crosses zero is the zero-gamma level, the same one TRACE marks as ZG. Price on one side or the other tells you which regime the book is in.
- Read GEX and DEX together. GEX tells you how much the hedge changes when price moves; DEX tells you where the hedge stands now. A large DEX with small GEX is a directional book that does not push back much.
- In TIME mode, vanna bars show where a change in volatility would move dealer delta the most, and charm bars show where the passage of time would. Charm matters most late in the day, as 0DTE options decay fastest into the close.
- Mouse: the wheel zooms the price axis, Shift + wheel scales the bars, dragging pans, and FIT (or a double click) returns to the default range of about 3% around price.
Unsure? Ask ChatGPT about this
IV
Everything about implied volatility for the underlying, on one screen.
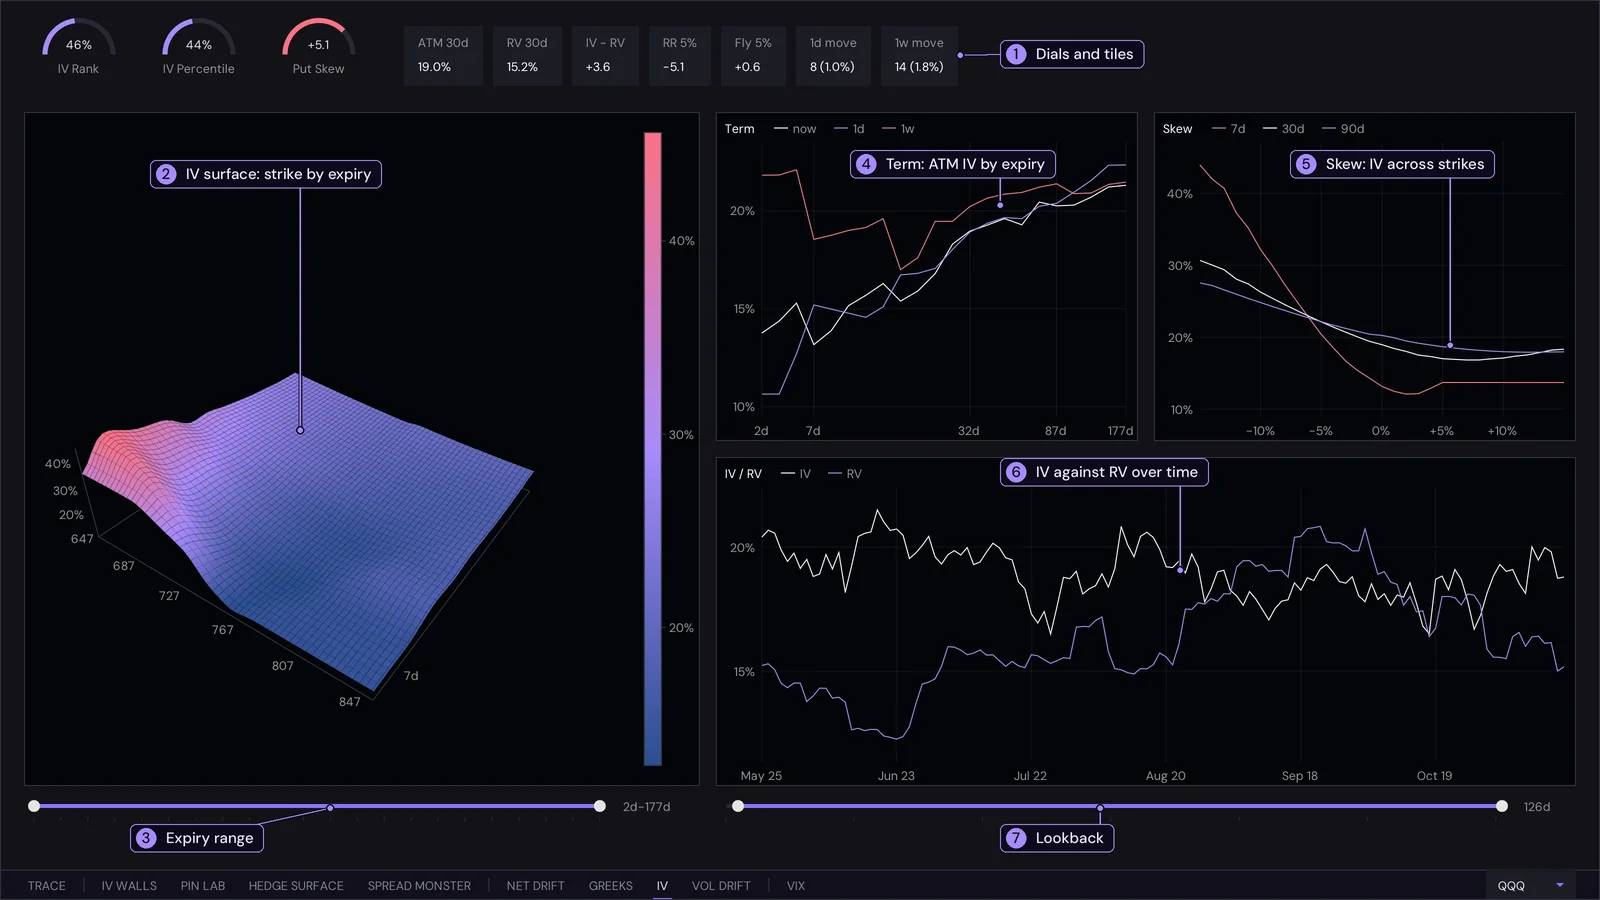
- Dials and tiles. IV Rank is where 30-day IV sits between its low and high over the lookback; IV Percentile is the share of days it was at or below today's level. Put Skew / Call Skew is 30-day IV 5% below price minus IV 5% above (positive means puts cost more); the dial fills at 10 vol points either way. The tiles are ATM 30d (at-the-money implied vol), RV 30d (realised vol), IV - RV, RR 5% (IV 5% above price minus IV 5% below), Fly 5% (the average of those two wings minus at-the-money IV) and 1d move, 1w move (the one-standard-deviation move the options imply, in points and percent).
- Surface. Implied vol by strike and expiry. Drag to rotate, wheel to zoom, double click to reset.
- Expiry range. The slider under the surface sets which expiries are drawn.
- Term. At-the-money IV for each expiry now, a day ago and a week ago.
- Skew. IV across strikes from 15% below to 15% above price, for 7, 30 and 90 days.
- IV / RV. Implied and realised vol over time.
- Lookback. The slider on the right sets the lookback used by this chart and by the rank and percentile.
Interpreting it
- Rank and percentile tell you whether options are expensive or cheap against their own history. High means pricing in more movement than usual; low means the opposite. Percentile is steadier than rank when one extreme day sits in the range.
- IV - RV positive means options cost more than the movement that has actually happened (a volatility risk premium); negative means the market has been moving more than the options imply.
- Term structure. Normally longer expiries have higher IV. When the near end rises above the far end (inverted), the market is pricing a near-term event or stress. Compare the three lines to see how the whole curve has moved since yesterday and last week.
- Skew. A smile tilted to the left, with downside IV above upside IV, means puts are in demand. A positive Put Skew or negative RR says the same. A flatter or rising right side means call demand is stronger than usual. The three lines show whether the tilt is a short-term or longer-term feature.
- Fly 5% measures the curvature: higher means the wings are expensive against the centre, so the market is paying up for big moves in either direction.
- 1d move and 1w move turn all of this into a range you can compare with what price actually does.
- The surface is the same information in one picture: a ridge at short expiries is an event premium, a steep wall on the left is the put skew.
Unsure? Ask ChatGPT about this
IV WALLS Signature view
Where the options market expects price to live until an expiry, and where it runs out of room. Pick the expiry at the top right.
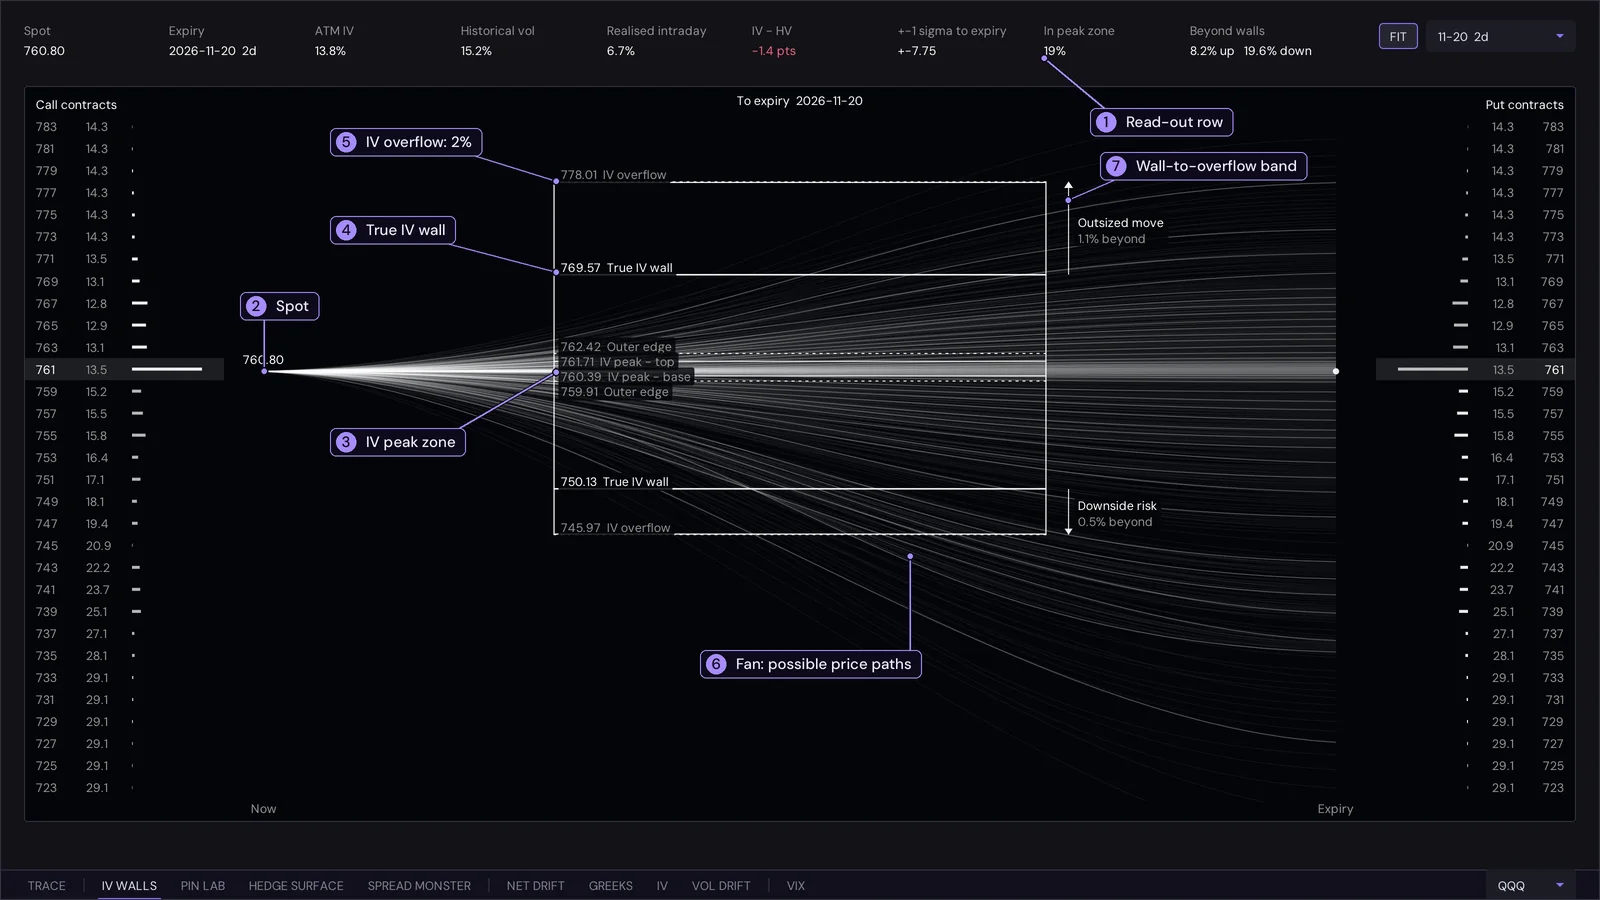
- Read-out row. In peak zone is the probability that the underlying finishes the expiry inside the peak zone. Beyond walls is the probability of finishing beyond the true IV wall, up and down separately. +-1 sigma to expiry is the move the at-the-money IV implies. IV - HV is implied minus historical vol; Realised intraday is shown beside it.
- Spot. Every path in the fan starts at the current price.
- IV peak zone. The prices where the implied density is at least 60% of its maximum. The outer edge (25% of the peak) closes the zone.
- True IV wall. Where the density has fallen to 8% of its peak.
- IV overflow. The 2% line, the outer frame of the box.
- The fan. Paths from now to expiry, each ending at a price (down to the cent) that the same distribution allows. A few clearer lines run through a faint cloud of the rest, and they bunch where the distribution is most likely to finish.
- Wall-to-overflow band. The span from the true wall to the overflow line, as a percentage of spot.
Interpreting it
- Peak zone width. A narrow zone close to spot means the market has concentrated the probability near where price is. A wide one means it has not: the outcome is open. The probability in the read-out tells you how much weight sits inside.
- The walls are soft limits. Beyond the true wall the options market assigns little probability per dollar, so it is a sensible edge for the expiry. It is not support or resistance: price can go through it, it simply would be a surprise.
- Beyond the walls. The read-out gives the chance of finishing past each wall. If the up and down figures differ a lot, the market sees the tail on one side as heavier (skew).
- Overflow and the band. Reaching the overflow line is a tail event for that expiry. A small band percentage means the tail is steep: probability falls away quickly, so the walls are closely spaced; a large one means it thins out slowly.
- IV - HV. Negative means options are cheap against recent movement, so the walls may be tighter than price has been behaving; positive means the options are pricing more than recent movement.
- The fan bunches where the density is highest. Use it to see how quickly the range opens with time, and compare expiries by switching the selector.
Unsure? Ask ChatGPT about this
How it is computed
The implied probability distribution comes from that expiry's own IV smile (the second derivative of the call price with respect to strike). The peak zone, outer edge, true wall and overflow are the prices where the density falls to 60%, 25%, 8% and 2% of its peak. The left column lists call strikes with their IV and a bar for the density at that strike; the right column lists puts. FIT (or a double click) frames the walls, their labels and the outermost fan paths; the wheel zooms and dragging pans.
PIN LAB Signature view
Where price is most likely to settle at the close, and the gamma landscape behind it. Two panels: a 3D gamma terrain on the left and a pin map on the right.
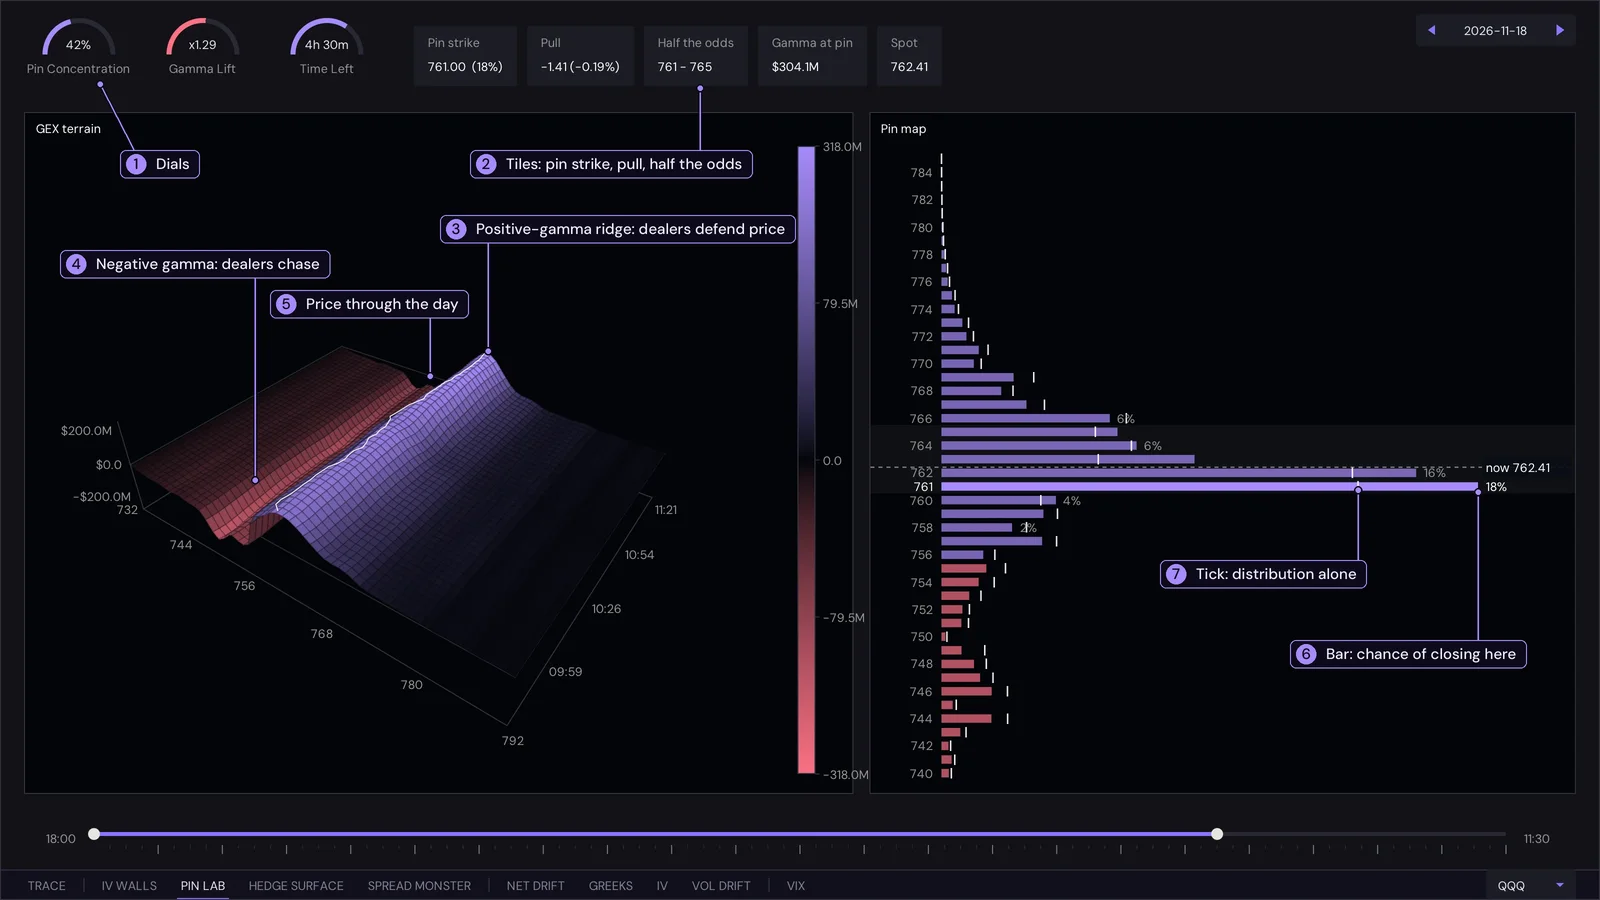
- Dials. Pin Concentration is the combined chance of the top three strikes. Gamma Lift is how many times likelier the top strike is than the IV distribution alone says. Time Left is the time to the 16:00 close.
- Tiles. Pin strike and its chance, Pull (its distance from price), Half the odds (the strikes that together hold half the probability), Gamma at pin and Spot.
- Positive-gamma ridge. Strikes with large positive net 0DTE gamma, where dealers sell into rises and buy into dips.
- Negative gamma. Strikes where dealers hedge in the direction of the move, buying rises and selling falls.
- Price line. The white line is the underlying walking across the surface through the day; the right edge is now.
- Bar. The modelled chance that price settles at that strike at the close. Purple strikes have positive gamma, pink negative.
- Tick. The IV distribution alone, with no gamma weighting.
Interpreting it
- Concentration and lift together. High Pin Concentration says the odds are packed onto a few strikes; Gamma Lift above 1 says gamma is adding to that, not just the options prices. Both high is a genuine pin candidate. A flat map with a low lift means the close is open.
- Bar against tick. The gap is what gamma contributes. A bar much longer than its tick is a strike that dealer hedging is pulling price toward; a bar shorter than its tick is a strike that hedging pushes price away from.
- Pull. A small distance to the pin means price is already there and mostly has to stay; a large one means a move is needed to get there. Check Time Left: the effect strengthens as the close approaches.
- Half the odds is a ready-made range for the close: price should end inside it about half the time, if the model is right.
- The terrain. A ridge that runs the whole day and lines up with price is established support for the pin. A ridge price has already walked away from, or a valley under price, says hedging is not holding price there.
- It is a model. Treat the pin as the most likely strike on the evidence of options prices and positioning, not as a promise. Scrub the session slider to see how the map looked earlier.
Unsure? Ask ChatGPT about this
How it is built
GEX terrain. Net 0DTE gamma by strike and time as a 3D surface. Heights use a square-root scale so smaller structure stays visible beside a few very large strikes; the colour bar shows the real values. Drag to rotate, wheel to zoom, double click to reset.
Pin map. For each strike, the chance that price settles there at the close: the risk-neutral distribution from the IV smile (the one IV WALLS draws), squeezed to the time left in the session, times a gamma weight per strike (positive gamma pulls price in, negative gamma pushes it away, and the effect grows as the close approaches). The shaded band holds half of the probability, and the dashed line is the current price. Move the right handle of the session slider to see the map as of an earlier time of day.
VIX
Intraday candles of the VIX for the last two sessions in 10-minute bars, refreshed automatically every minute.
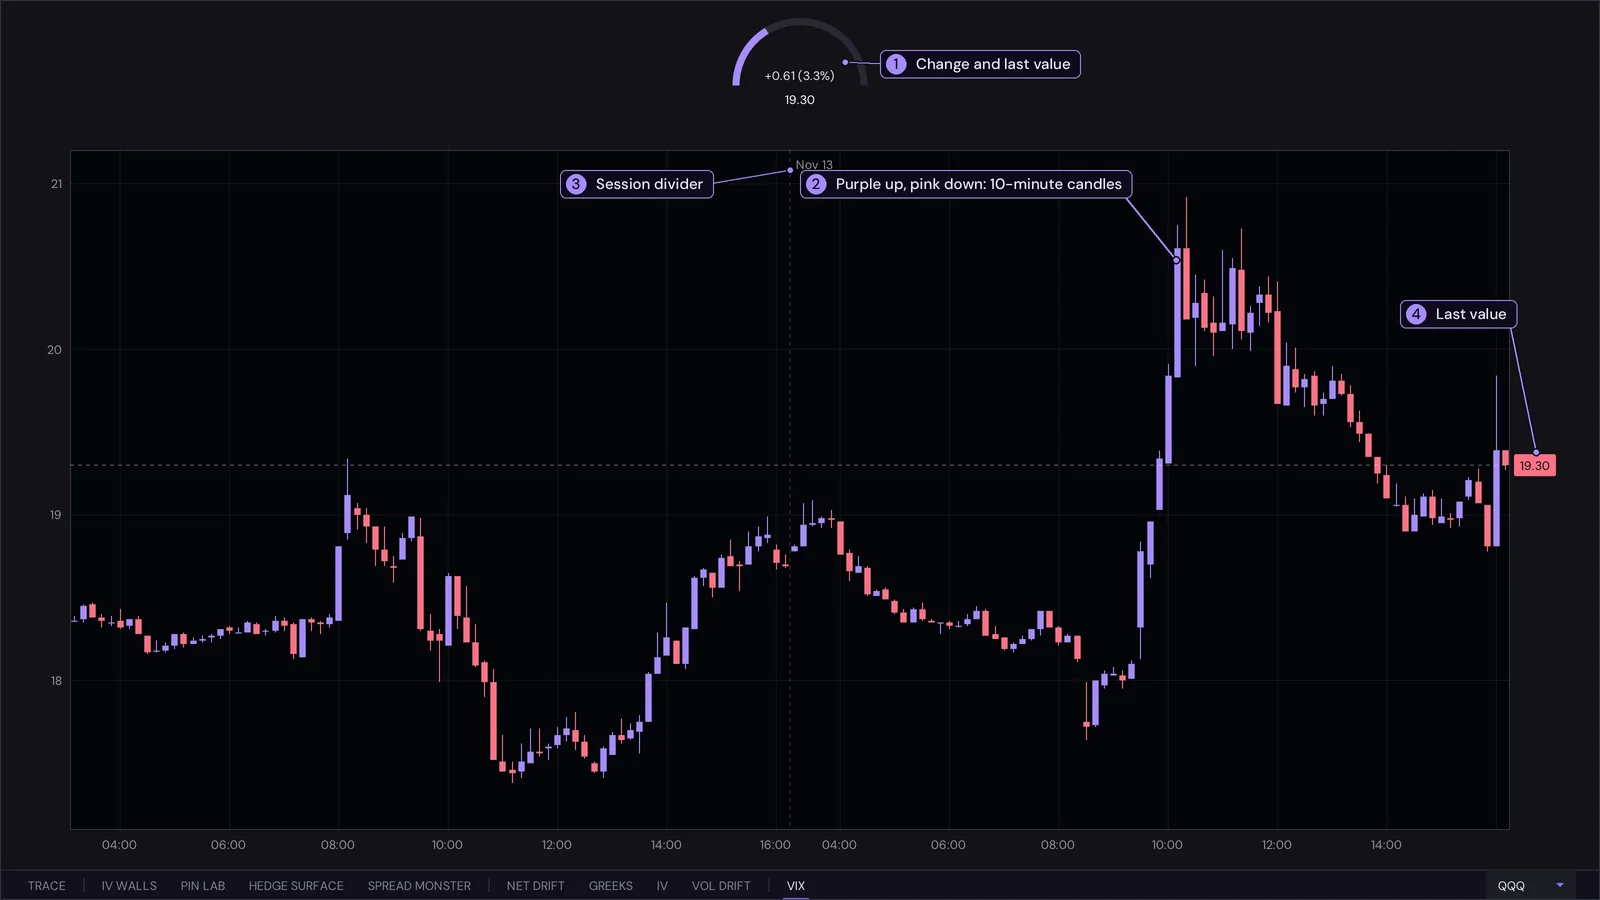
- Meter. The change against the previous close, in points and percent, and the last value.
- Candles. Each candle is a 10-minute bar: purple when the VIX rose over it, pink when it fell, with the wick showing the high and low.
- Session divider. The dotted line marks where one session ends and the next begins.
- Last value. The tag on the right axis and the dashed line across the chart.
Interpreting it
- VIX rising means the market is paying more for index protection and expecting larger moves; falling means demand for protection is easing. It usually moves opposite to price, so a VIX that rises while price is flat or up is a warning that hedging demand is building.
- Size of the move. The meter puts the day in context: a few percent is ordinary, a double-digit percent move is stress.
- Level against the session. A spike that fades back within the day (long upper wicks, then pink candles) is a shock being absorbed; a series of higher lows is stress building.
- Use it next to IV and IV WALLS: a rising VIX lifts the whole implied-vol surface and widens the expected range.
- Mouse: the wheel over the chart zooms time and over the left axis zooms the price scale, dragging pans, and a double click resets. Hover for a crosshair with the bar's open, high, low and close.
Unsure? Ask ChatGPT about this
VOL DRIFT
How intraday realised volatility develops against the implied volatility the options market is pricing.
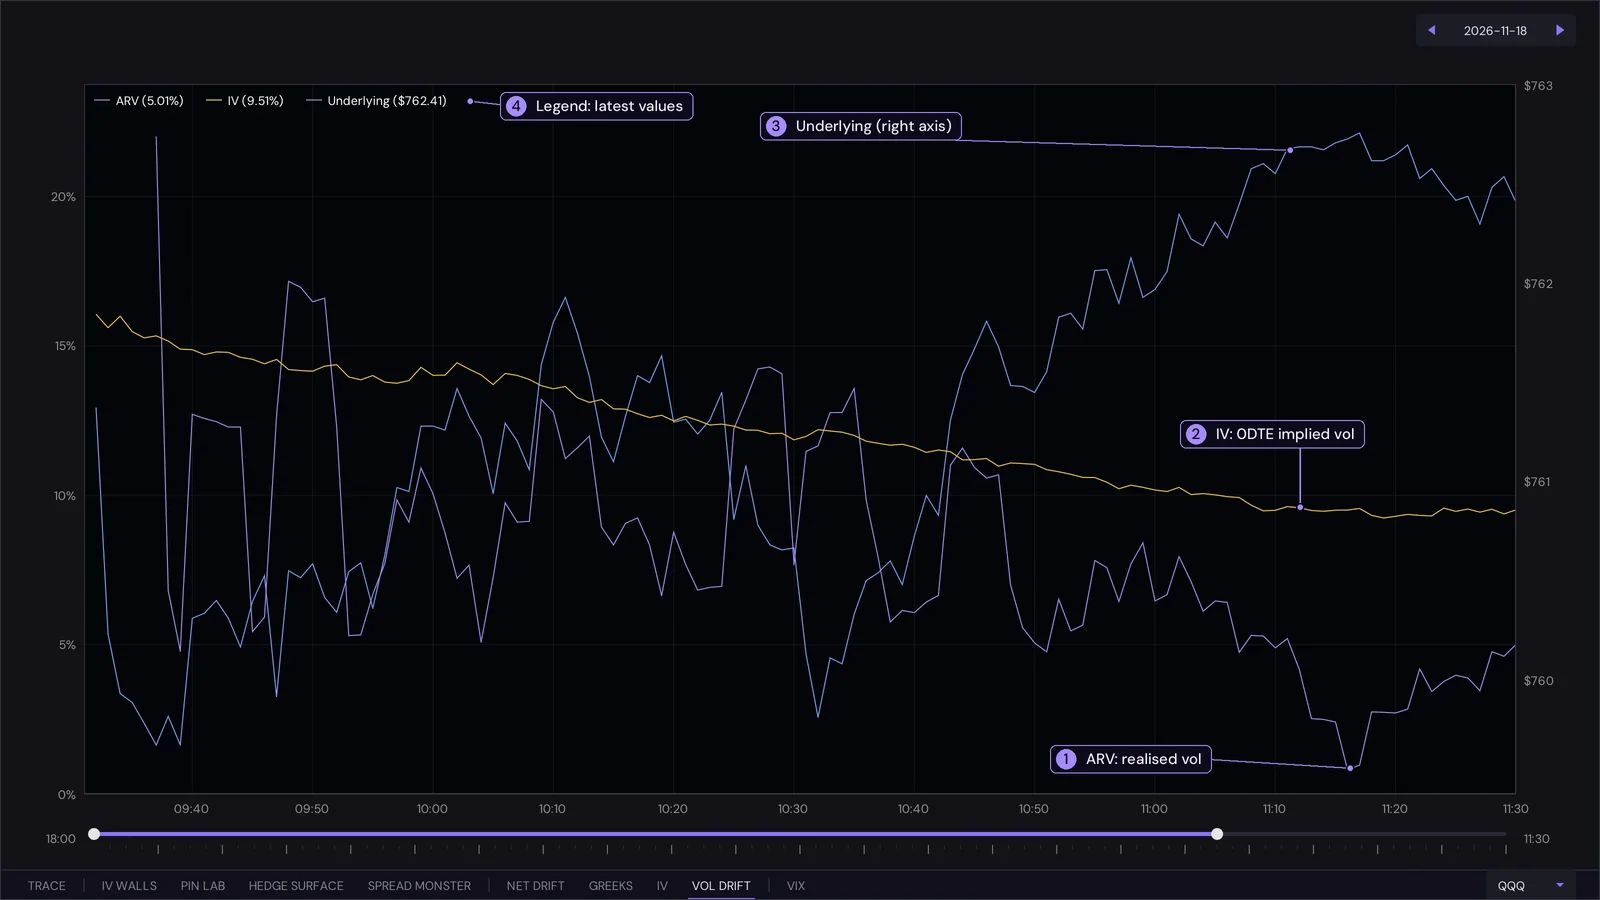
- ARV. Annualised realised vol of the last five one-minute returns. It is jumpy by nature.
- IV. The at-the-money implied vol of today's (0DTE) expiry, recorded every minute.
- Underlying. The price on the right axis.
- Legend. The latest value of each line.
Interpreting it
- IV above ARV means the options are pricing more movement than is happening. Sellers of options are being paid for movement that has not shown up, and the market is calm against its own expectations.
- ARV above IV means price is moving faster than the options expected. Options are cheap against what is actually happening, which is when moves tend to feel violent.
- Spikes in ARV line up with sharp moves in the price line. Watch whether IV follows: IV rising after a realised spike means the market is repricing risk; IV staying flat means it considers the move a one-off.
- IV drifting down through the day is normal for a 0DTE option as time runs out. A day where IV rises against that tide is the market adding risk.
- The session slider sets the window.
Unsure? Ask ChatGPT about this
HEDGE SURFACE Signature view
The hedging flow dealers are forced into by every price and volatility scenario, as one map.
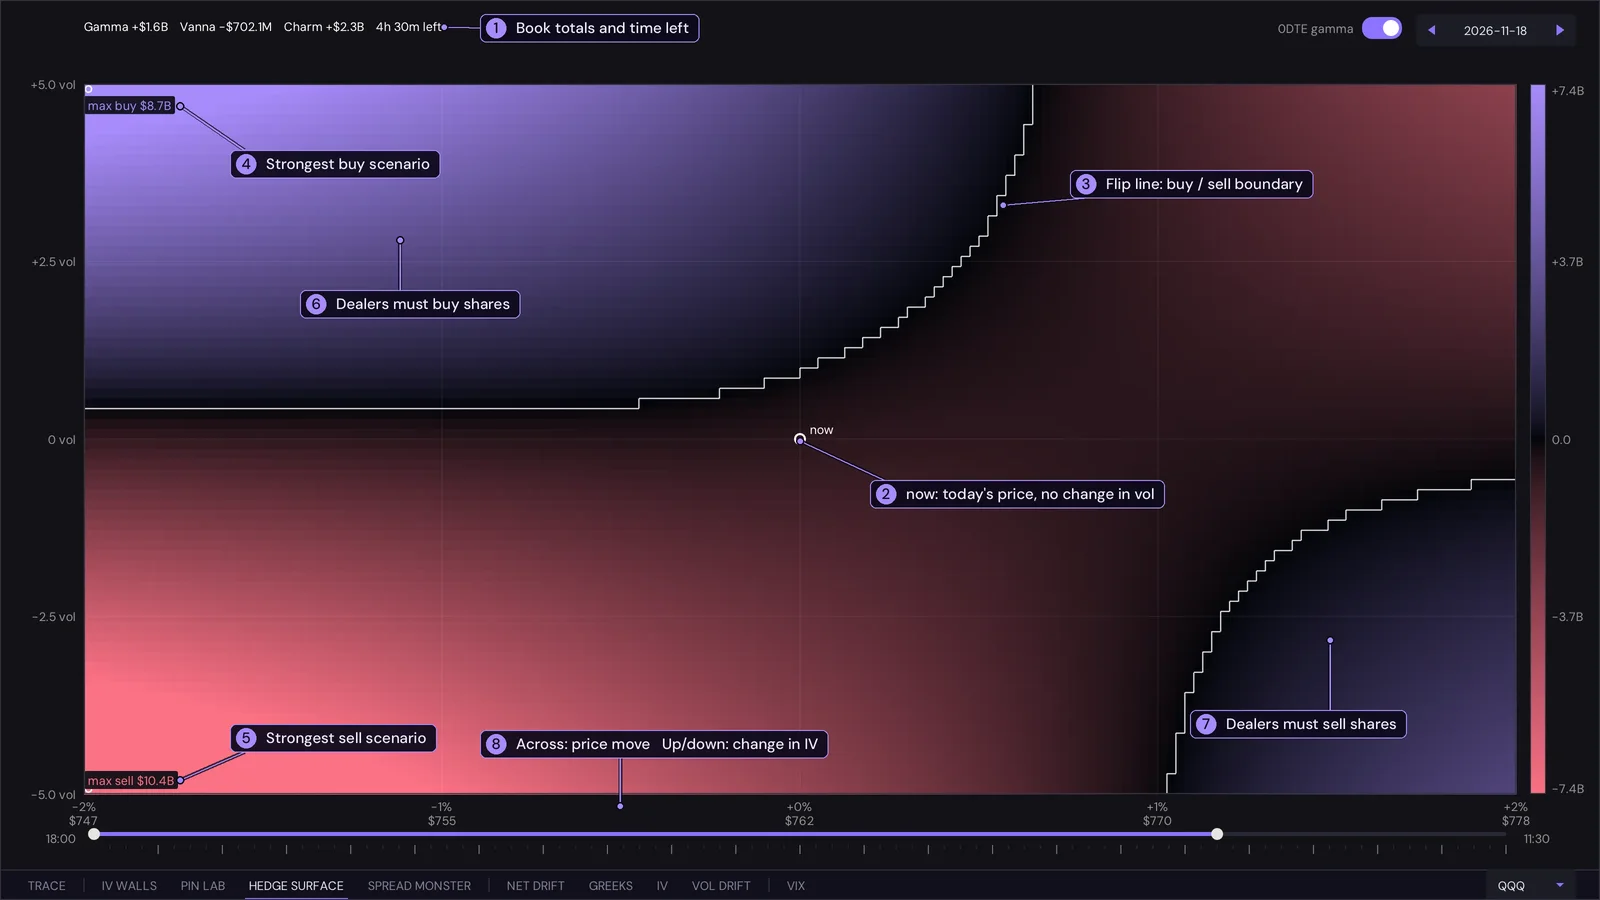
- Book totals. The book's total gamma, vanna and charm, and the time left in the session. These are the three terms the surface is built from.
- now. Today's price with no change in volatility, the reference point.
- Flip line. The white contour where the net hedging flow is zero.
- Strongest buy. The scenario in which dealers have to buy the most shares, with its dollar size.
- Strongest sell. The scenario in which they have to sell the most.
- Purple. Dealers must buy shares to stay hedged; brighter is more dollars.
- Pink. Dealers must sell shares; the colour bar on the right gives the dollar scale.
- Axes. Across is the price move from now, -2% to +2%, with the price under each tick. Up and down is the change in implied vol, -5 to +5 points.
Interpreting it
- Look at what is just to the right of now (price up) and just to the left (price down). If rises meet pink (dealers sell) and falls meet purple (dealers buy), hedging leans against the move and tends to stabilise price. If it is the other way round, hedging follows the move and tends to amplify it.
- Distance to the flip line. The closer it is to now, the smaller the move that changes dealer behaviour. A flip line well away means the current regime is robust.
- Vertical reading. Moving up the map means volatility rising. If the colour changes sharply as you go up from now, the book is exposed to vanna: a vol spike or crush would force dealers to trade even with price unchanged.
- Brightness says how big the flow is in dollars. A scenario that is bright but far from now is a tail; one that is bright and close is what to expect from a modest move.
- Strongest scenarios mark the corners of the range where hedging pressure peaks. Their size compares the book from day to day.
- Hover for the scenario: its price, the move, the change in vol and what dealers would have to buy or sell. The 0DTE gamma switch limits the gamma part to today's expiry; vanna and charm always cover every expiry. Move the right handle of the session slider to see it as of an earlier time.
Unsure? Ask ChatGPT about this
How it is computed
The flow is minus the change in the book's delta: delta(move, vol) = gamma(move) + vanna x vol change + charm x time left. Gamma follows the strike profile, so price crossing a strike meets that strike's gamma. It is a first-order map, not a revaluation of every option.
SPREAD MONSTER Signature view
The 0DTE chain as a map of dealer inventory, one row per strike: calls on the left, puts on the right, and Net Dealer in the last column. It reads the open interest and the volume traded so far at every strike of the expiry that ends today, and combines them into one question: if price settled at this strike, how lopsided would the in-the-money inventory be?
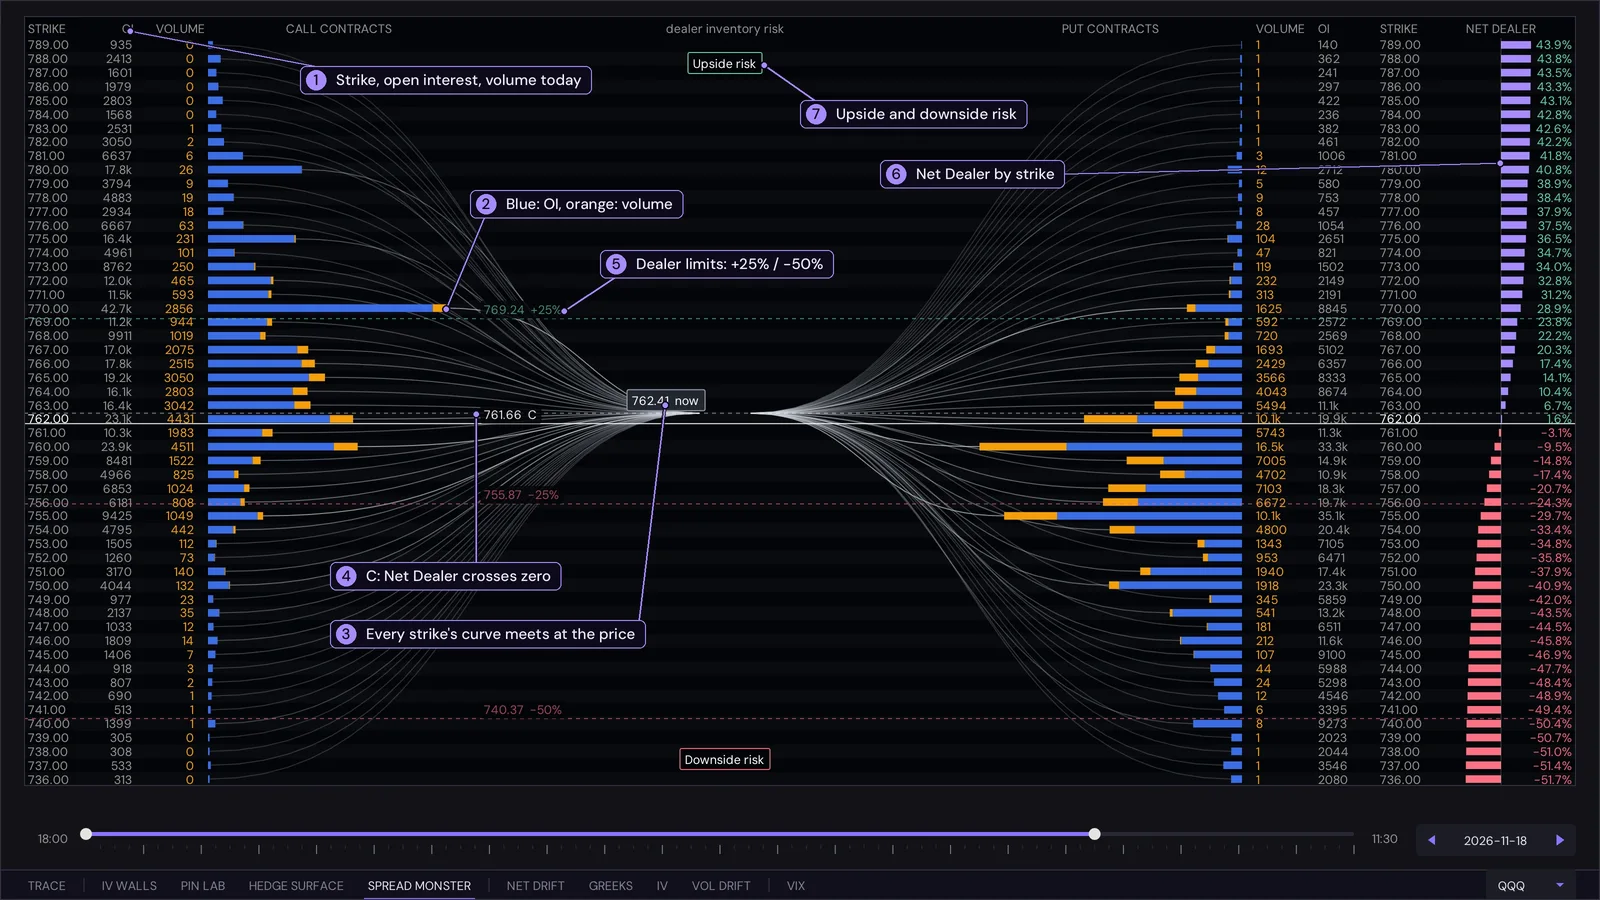
- Row data. Strike, open interest (what stood at the open) and the contracts traded since the open, for the calls here and the puts on the opposite side.
- Bars. Blue is open interest, orange is volume traded today, stacked. Open interest is only updated by the exchange once a day, so intraday changes show as orange.
- Curves. Each curve joins the end of a strike's bar to the current price. They carry no extra data; they bunch where the inventory is.
- C. The strike where Net Dealer crosses zero: in-the-money call inventory equals in-the-money put inventory.
- Limit lines. The strikes where Net Dealer reaches +25%, +50%, -25% and -50%.
- Net Dealer column. The value at every strike. It rises from strongly negative at the bottom of the chain to strongly positive at the top; purple is positive, pink negative.
- Upside and downside risk. The two tags at the top and bottom of the centre axis, marking the outer limits of the chain.
How Net Dealer is computed
For a strike K, Net Dealer(K) = 100 x (call inventory at or below K - put inventory at or above K) / total inventory. Calls at or below K and puts at or above K are exactly the contracts that would be in the money if the underlying finished at K, so Net Dealer(K) is the net in-the-money call inventory against put inventory at that settlement price, as a percentage of everything open. It must rise with K: each step up adds call inventory to the first term and removes put inventory from the second. Dealers are taken to be on the other side of the public, so a positive value is a net short-call exposure for them at that settlement, a negative value net short puts. Both terms use the same inventory, open interest plus today's volume, so the number moves during the session.
| Term | What it is |
|---|---|
| Inventory | Open interest plus volume traded today, at a strike. Volume is counted as new positions; closing trades are not visible in the data, so this overstates when positions are being closed. |
| Net Dealer | At a strike: call inventory at or below it, minus put inventory at or above it, as a percentage of all inventory. |
| Centre (C) | The strike where Net Dealer crosses zero: call inventory below it equals put inventory above it. Not a price target. |
| PML | Max pain: the strike where the payout to all option holders is smallest, so where the writers keep the most premium. |
| Floor, Ceiling | The 20th and 80th percentile of the inventory by strike: the outer edges of the landscape. |
Interpreting it
- Price against C. The distance from price to C, and to the +25 and -25 lines, shows how balanced the chain is at today's expiry. A chain whose C sits far from price is lopsided around where the market is.
- Walls. A single strike with a very large bar close to price concentrates the in-the-money swing there. Look at the Net Dealer column on either side of it: a steep step is a strike that moves the balance.
- Flow. Watch the orange. Orange concentrated at strikes near price is new positioning today; orange far from price is mostly hedging or lottery tickets.
- Hover a row for its numbers. Move the right handle of the session slider to see the chain as of an earlier time of day. The date picker is at the right end of the slider.
Unsure? Ask ChatGPT about this
What it does not say
- It is a picture of positioning, not of what anyone expected or whether a move surprised them.
- It does not predict direction. Price can run through a limit line or turn before it.
- It cannot see who is the customer, who is the dealer, or why a contract traded (a hedge, a bet, part of a spread). The dealer side is an assumption.
Definitions
| Metric | What it is | Unit |
|---|---|---|
| GEX | Gamma exposure: how much dealers must trade for a 1% move | $ per 1% move, 0DTE |
| DEX | Delta exposure: the dealers' net directional exposure | $ delta, 0DTE |
| Charm | Charm exposure: how delta decays as time passes. Modelled for the 0DTE expiry and carried on to the close (see TRACE) | $ delta per day, 0DTE |
| Vanna | Vanna exposure: how delta changes with volatility | $ delta per vol point, all expiries |
Per strike, exposure = the greek x open interest x 100 x the underlying's price. Calls count positive and puts negative. Greeks are Black-Scholes with a contract multiplier of 100. 0DTE means contracts expiring today.
A wall is a strike with unusually large exposure. Zero gamma (the "gamma flip") is where net exposure changes sign. Positive gamma tends to dampen price moves and negative gamma to amplify them.
Unsure? Ask ChatGPT about this
Key and account
- The key is your password. It starts with
ak_live_followed by 24 letters and digits. Paste it into the app's Key field once; the app remembers it for your Windows user. - One session at a time. A second sign-in closes the first with "signed in elsewhere".
- Regenerate on the account page replaces the key and emails the new one; the old one stops working at once.
- Refund guarantee: there is no free trial, but you can ask for a full refund within 7 days of buying a plan, on the gammawalls discord or at support@gammawalls.io.
- The Account page shows your plan and access.
Notes
- Everything here is information, not investment advice. PIN LAB and the IV walls are models built from option prices and positioning, not predictions.
- Exposure follows a fixed convention (calls count positive, puts negative); it is not a measurement of who actually holds which contracts. Real dealer positioning can differ.
- Please read the Terms (the data is for your own use and may not be redistributed) and the Privacy Policy.